🎯
Cryptovizor
English
English
  • 🎯Cryptovizor User Manual
  • Modules overview
    • 🚀Delta BTC module
      • Delta and cumulative delta
      • Description of the Delta module
    • 📈Cryptoscreener module
      • Volume Screener
      • Left block table
      • RSI Screener
      • Right block table
      • Volatility factor
    • 🏆Cryptocurrency Heatmap Binance
      • Heatmap construction
      • Volume
      • Volume change
      • Price change
      • RSI change
      • Volatility
    • 🔋Multicharts + Trends
      • Defining a trend
      • Trends table
    • ⚡Signals, notifications module
      • Single alerts
        • Creating a single alert
        • Alert Parameters for Price Timeframe
        • Getting a chart in Telegram
      • Notification parameters
        • 1. PRICE notifications
        • 2. Volume USDT Moving
        • Order of magnitude volume
        • 3. Positive Delta Volume USDT Moving
        • 4. Negative Delta Volume USDT Moving
        • 5. Any Delta Volume USDT Moving
        • 6. RSI notifications
        • 7. Volatility
        • 8. Volume USDT Candlesticks
        • 9. MA Trend
        • 10. MA 50
        • 11. MA 200
      • Saving an alert
      • Creating a notification from the Tradingview chart
      • Group signals
        • Token System
        • Creating a group signals
        • Examples of signal combinations
      • Alert logs
      • Draft
      • Webhooks
        • How to Create a Webhook?
        • Finandy configuration
        • List of Webhooks
        • Webhook templates
        • Placeholders
        • Signal setup in Finandy
      • Webhook logs
    • 🖥️Terminal Tradium
    • ◀️Connecting Telegram
    • ⚙️Settings
      • Watchlists
      • Running line
      • MA parameter
      • Push notifications
        • Setting up MacOS
        • Setting up Windows
        • Brave browser
        • Opera browser
        • Google Chrome browser
        • Safari browser
      • Change Email and Name
  • General information
    • YouTube
    • Pricing
    • Rules
    • Contacts
    • Policy
    • FAQ
Powered by GitBook
On this page
  1. Modules overview
  2. Multicharts + Trends

Trends table

PreviousDefining a trendNextSignals, notifications module

Last updated 1 year ago

Trends table

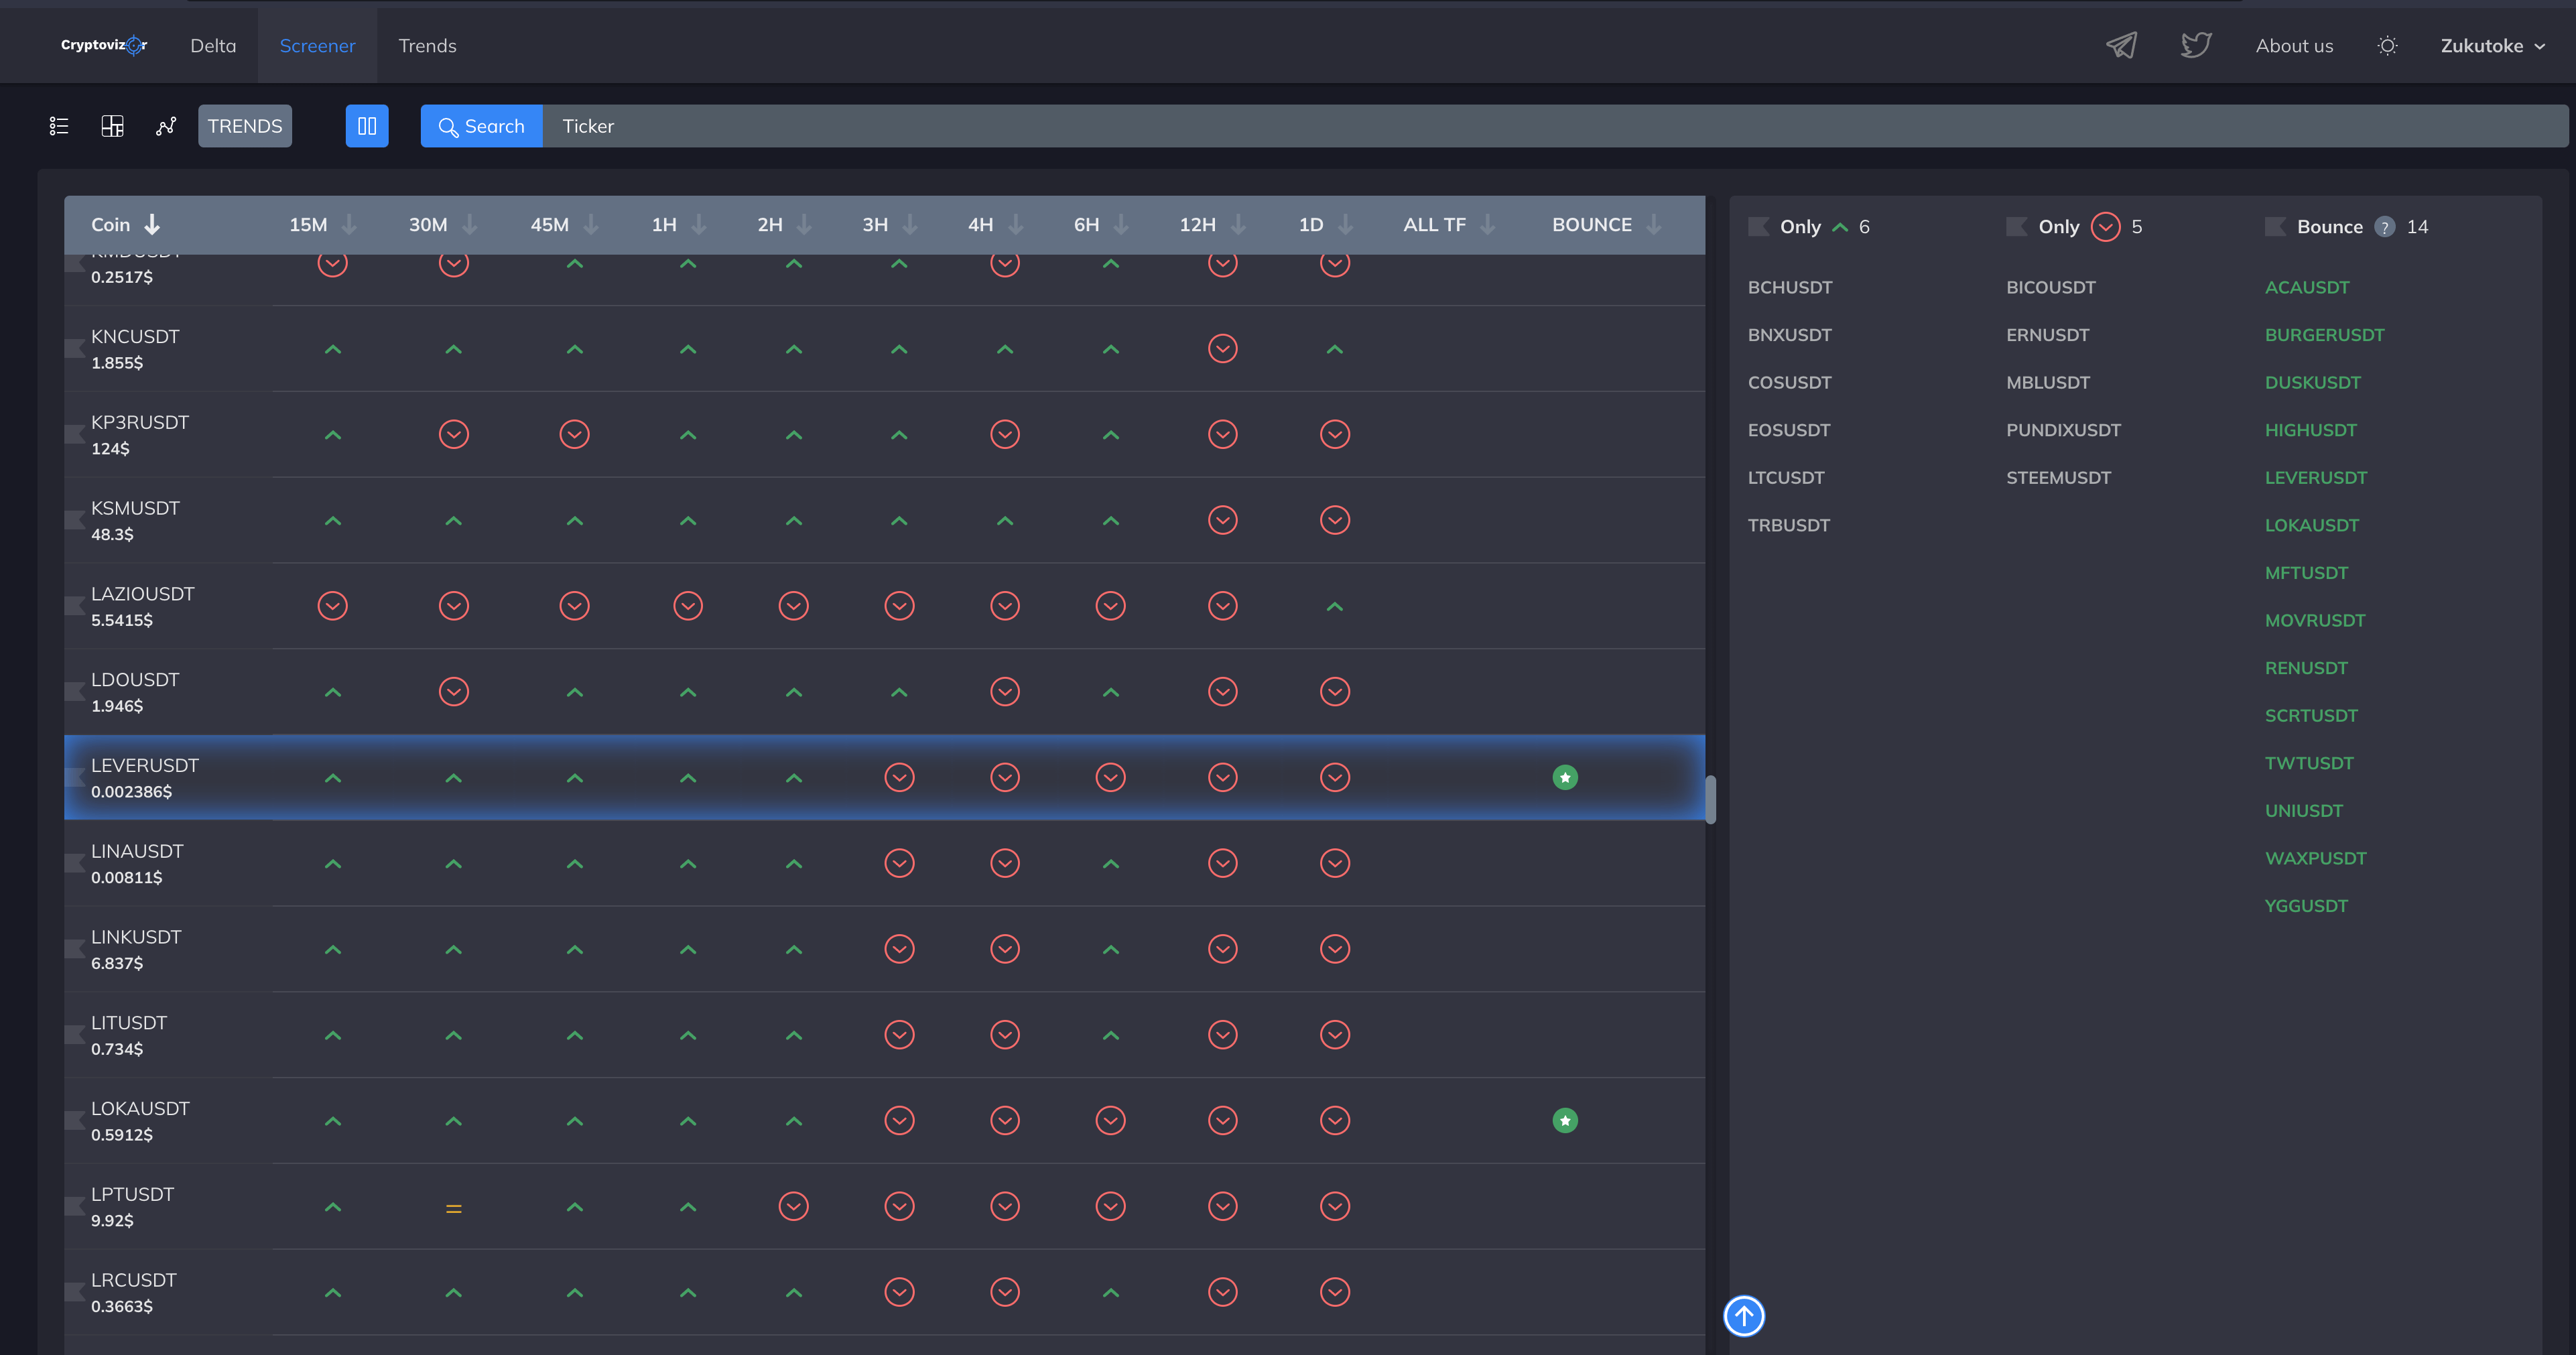
All trends are based on line charts. The two tabs are linked.

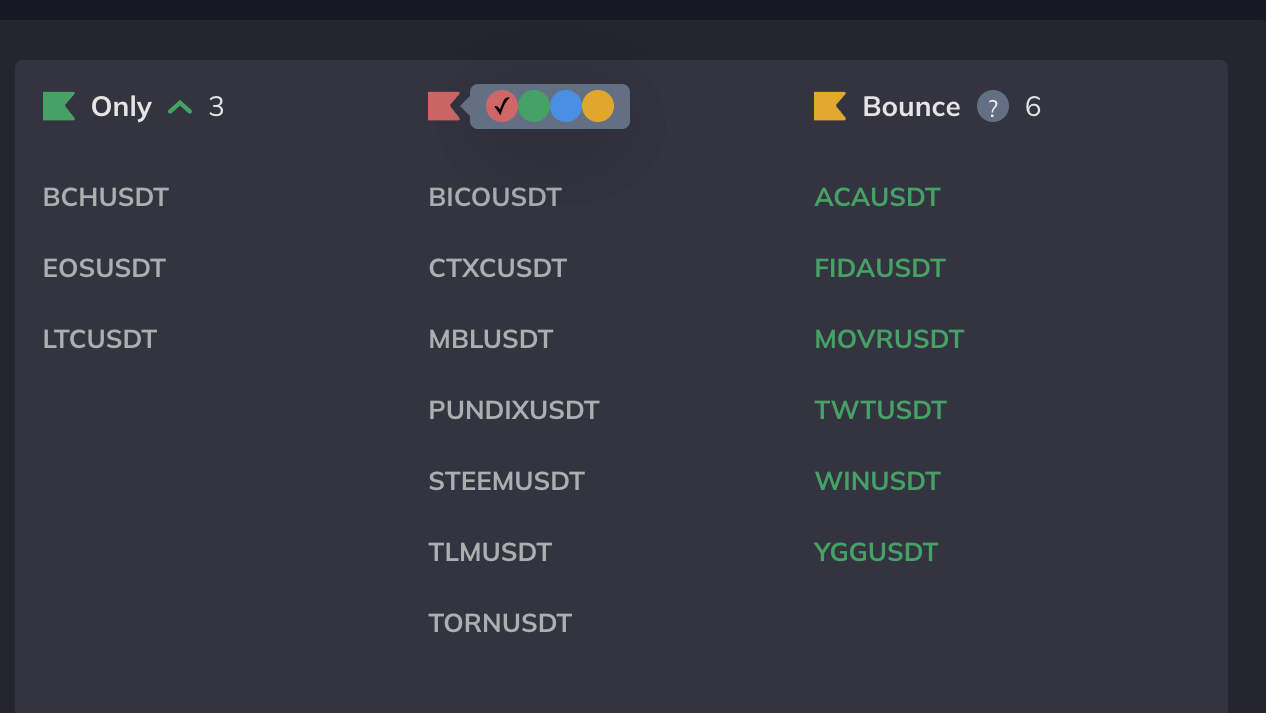
The table has two blocks – trends and groups of tickers on a common basis.

  • If the price at the beginning of the period is less than the current price, it is an uptrend

  • If the price at the beginning of the period is equal to the current price, it is a flat

  • If the price at the beginning of the period is higher than the current price, it is a downtrend

A star in the ALL TF column informs about the full prevalence of the trend.

A red star means "only down" (there is a downtrend for all periods)

A green star means "only up" (there is an uptrend for all periods)

BOUNCE signals a bounce or correction. This happens when the first five columns of trends have become opposite to the next five.

A green star represents a bounce on a downtrend

The red star is a correction on an uptrend

The right block of the table has active navigation. If you click on the ticker, the line in the left block is highlighted

You can add all coins from a column to the watchlist by clicking on the checkbox next to the column name.

By clicking on the ticker, you will open the minute chart

Navigation in the table is carried out with the up and down arrows along the borders of the chart window

🔋