🎯Cryptovizor User Manual

The market monitor
Demand and supply analysis
Real-time market data from the top exchanges
CEO Cryptovizor

Our Team has been day trading since 2017. We have tested out hundreds of tools and pointed out the ones which are the most efficient in terms of providing the right data for the technical analysis, managing the risks and improving the expected value of trades.
Delta BTC
Delta Chart Advantages
Aggregated BTC trading volume and delta
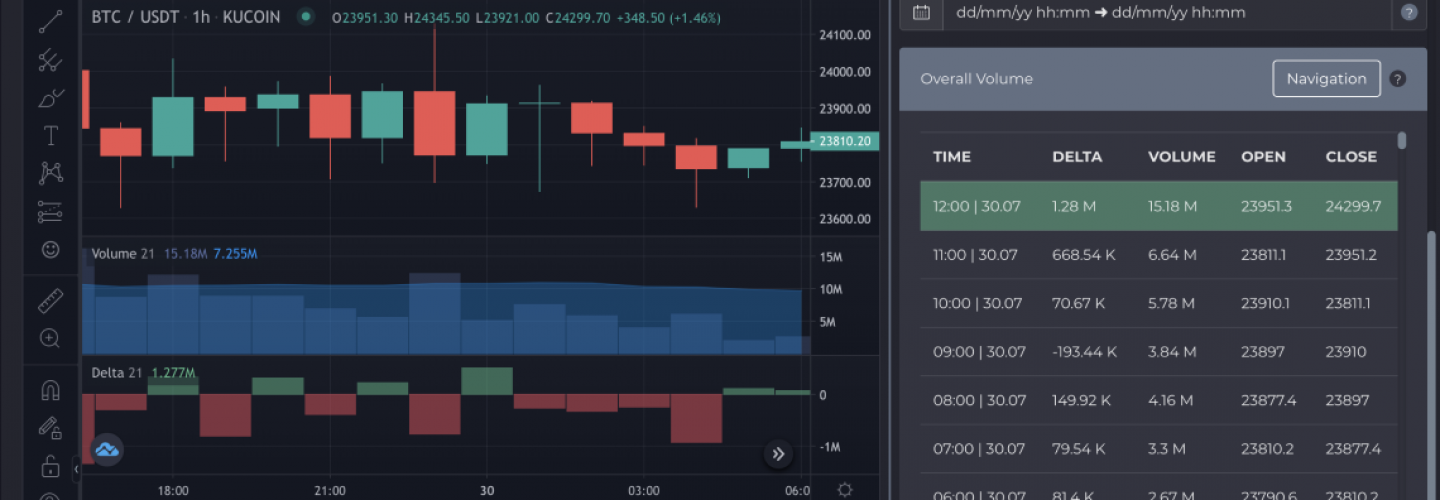
The Weighted average exchange price chart
You see the "true" price of bitcoin
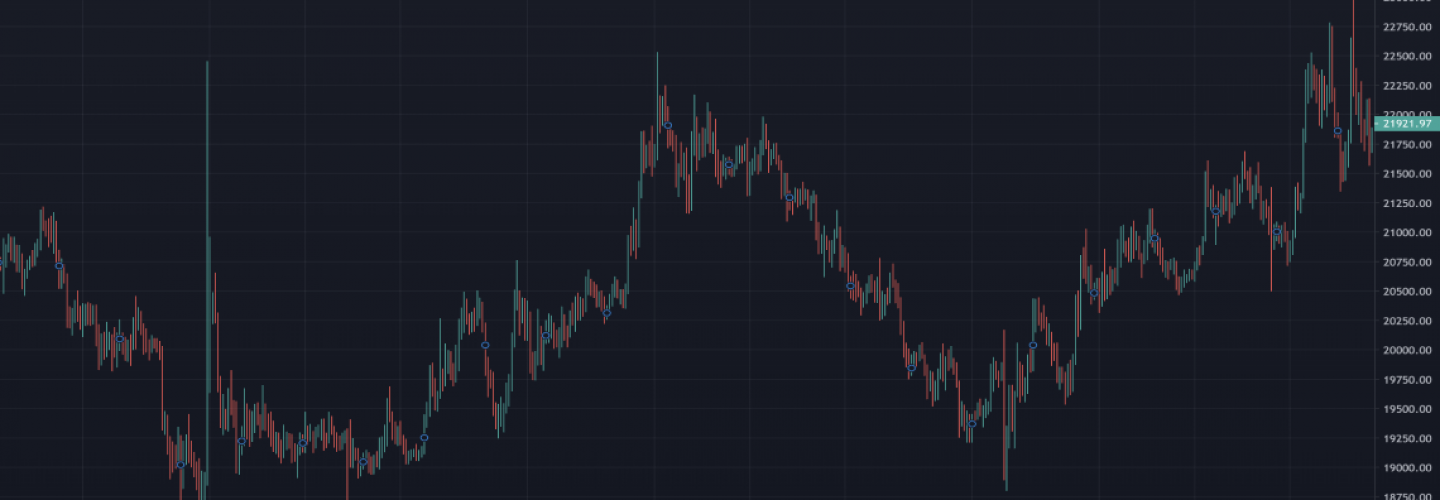
Built-in volume and delta indicators in USDT
Integated Trading View with all the features
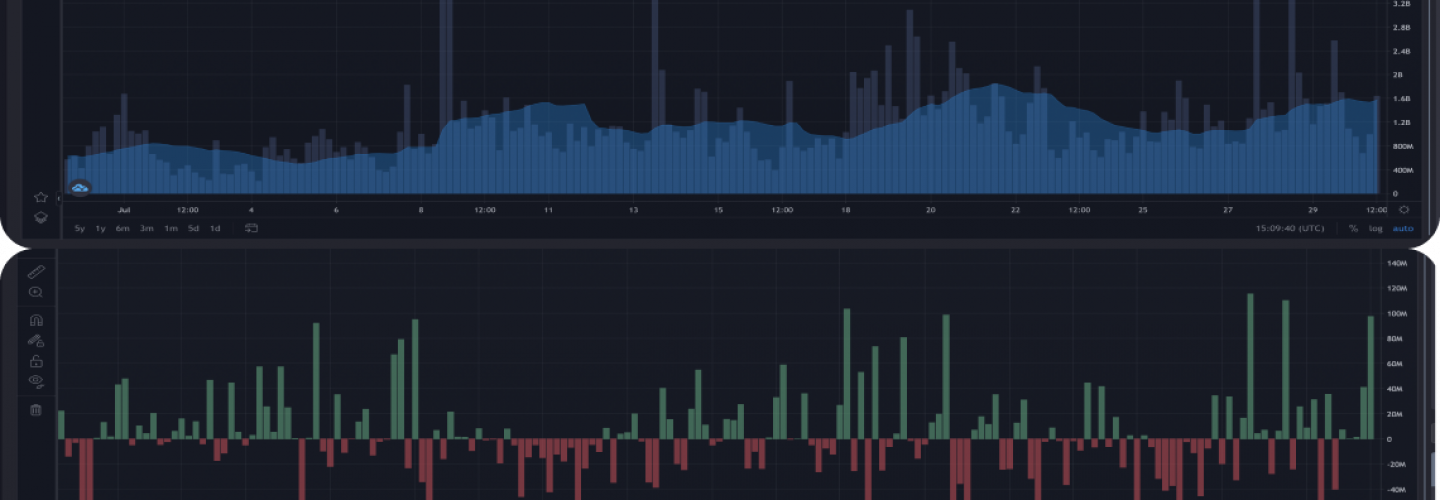
All USDT trading pairs Screener
 Binance Spot & Futures
Real-Time Data from Binance
5m, 15m, 30m, 1H, 2H, 4H, 12H, 1D time frames data received from Binance
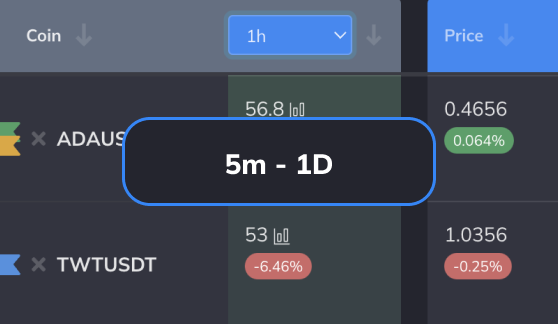
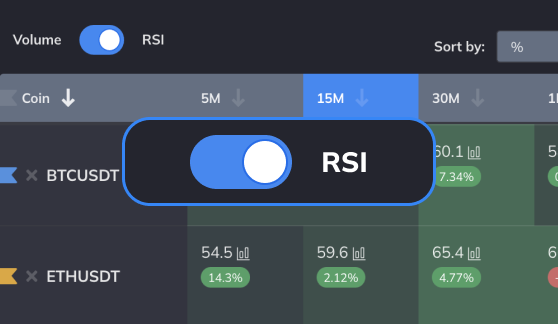
RSI (relative strength index)
Option to sort RSI according to the value or change in %
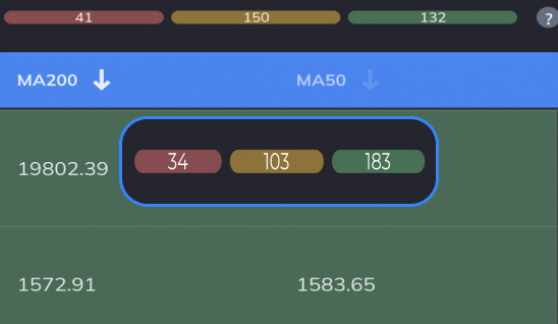
Quick trend detection by MA
Moving average data with customizability
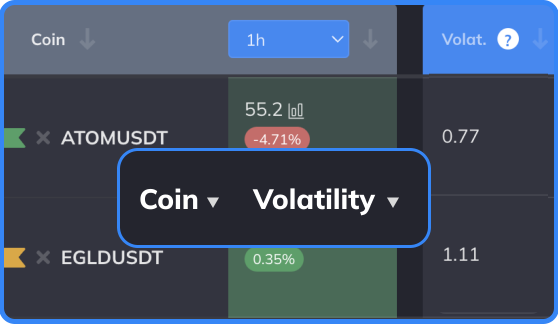
Volatility factor
Volatility indicator for all timeframes
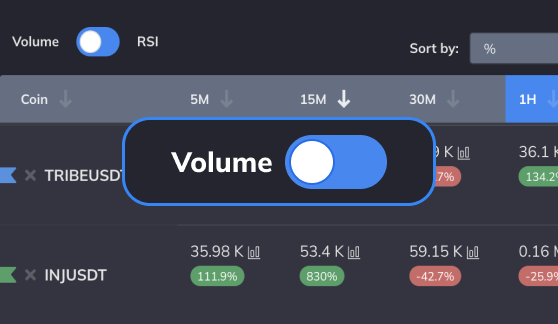
Trading Volume USDT
We use moving trade volume - the best solution for the screener
Delta + Cumulative Delta volume
The difference between the volume of market buy and sell orders per candle/bar (Delta) and per week CD (Cumulative Delta) Week

Cryptovizor is created by the team of day traders. The features have been chosen according to the basic needs in making every day decisions.
Vet daytrader
There is nothing like Cryptovizor in the market. Everything is in one place and it saves 2 to 3 hours daily letting you focus on trades only
Den daytrader
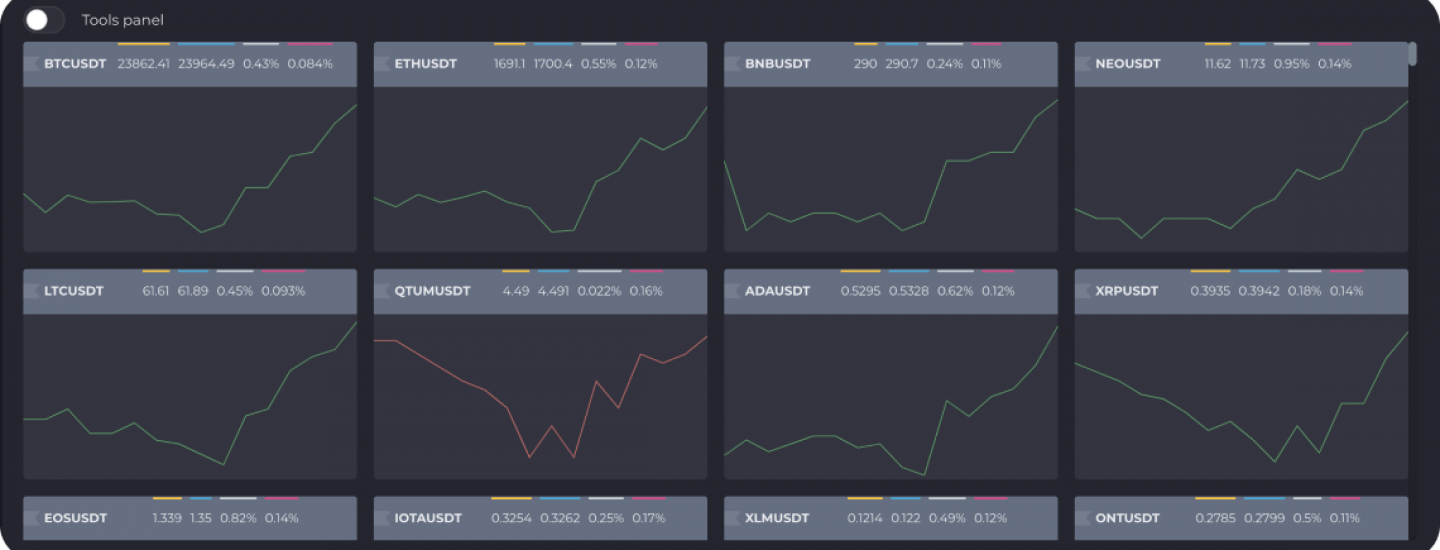
Linear Charts
15m, 30m, 45m, 1H, 2H, 3H, 4H, 6H, 12H, 1D linear charts in one data array
Trends
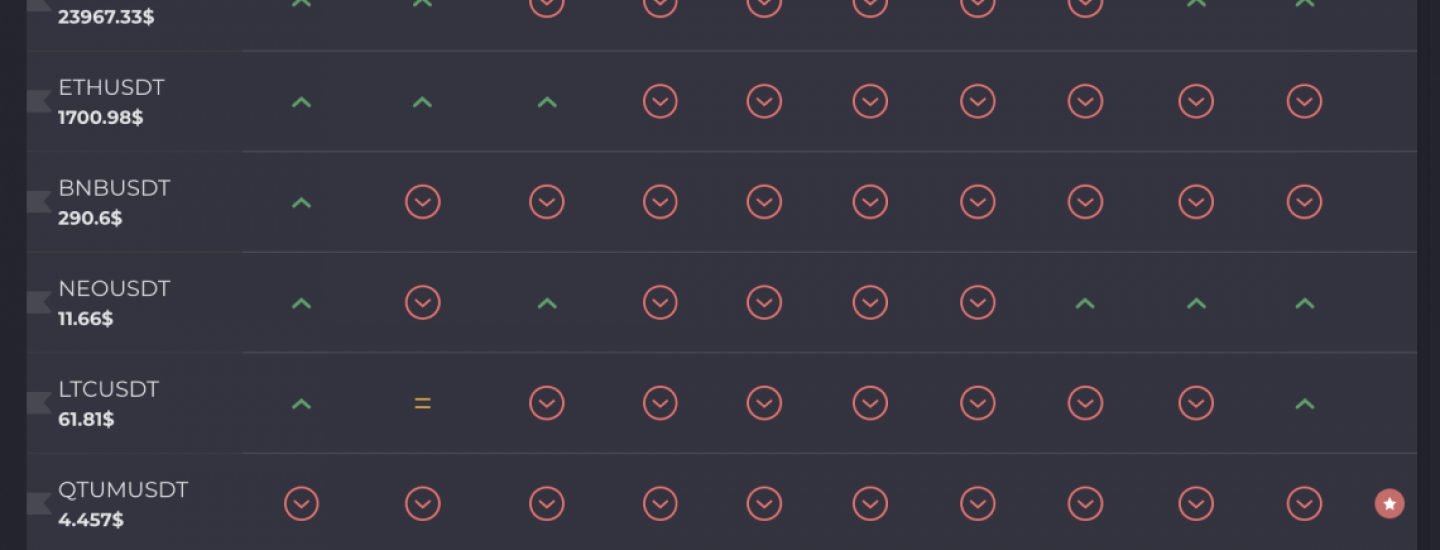
Trends feature reflects the current trend on the 15m, 30m, 1H, 2H, 4H, 6H, 12H and 1D time periods
Heatmap
Heatmap supports Volume, Volume change, Price Change, Volatility, RSI change

Time is money
We understand the value of getting the right information in a right time. The best case scenario is to be on the edge and get that information earlier than the others. Cryptovizor updates the BTC data every 10 seconds and other crypto assets - every 5 seconds
Security and Privacy
Personal data security is our main priority. We promise to keep the security and privacy on a high level for each of our users.
3 Active sessions per user
DDoS Attack Protection
Trusted hosting provider being always uptime
Two-factor Authentication

Information about Cryptovizor cryptocurrencies screener
Cryptovizor contains the best analytical tools that have proven themselves over many years of work. The software was created in a team of daytraders, as there were no necessary solutions on the market. Now this unique analytics service, which includes the best cryptocurrency screener, is available by subscription to any user.
Cryptovizor consists of two modules - Bitcoin Delta and Binance Spot USDT Pairs Screener.
Delta Bitcoin
The Bitcoin Delta module combines data from seven leading cryptocurrency exchanges on one graph: Binance, Bitfinex, Bitstamp, Coinbase, Huobi, Kraken and KuCoin. This chart is based on the average exchange spot price. Thus, you don't need to switch between exchanges to see the overall picture of the market. Now you have everything you need in one place. You're always aware of any price fluctuations.
The chart is integrated with TradingView, it has all the functionality of the basic version of this platform. This applies to both indicators and drawing capabilities. The markup and indicator settings are automatically saved on the chart.
In addition to price, the Bitcoin Delta module provides delta, trading volume and cumulative delta data, making it the best tool for cryptocurrency market analysis - a cryptocurrency screener online.
Screener for crypto assets (spot USDT pairs within Binance)
There are four tabs inside the module: table, line graphs, trends and heat map. Common to all four tabs is the ability to select the coin of interest or a list of coins, which can always be saved for later work as a watchlist.
Wherever you are, you can always click on the ticker to open the TradingView chart. This allows you to check on the chart the values you saw in the screenshot and make sure you are interpreting the analytical data correctly.
Table - Screener
The table shows data on timeframes of 5, 15, 30 minutes, 1, 2, 4, 12 hours and 1 day. This data we receive directly on the Binance exchange in real time.
The left block of the table displays RSI data or, at the user's choice, trading volume. The right block shows price, cumulative delta for the week, delta of the current timeframe, volatility factor, moving averages and trading volume. It is possible to sort the data by absolute value of RSI or volumes, as well as by percentage of change relative to the previous candle. Each cell of the left block contains an icon that allows you to access the chart of this cryptocurrency in the corresponding timeframe.
In order to activate the desired timeframe, click on the corresponding column header of the table. The selected timeframe determines the data in the right block, which can also be sorted - by price change, delta value, volatility, moving averages and trading volume.
All cryptocurrencies presented in the table are filtered into three states depending on what position the current price takes relative to the MA50 and MA200 slides on the 12-hour timeframe:
uptrend (green zone), when the slides are under the price values;
AZT (trader's active zone, marked in yellow) - the area between two slips, where the decisive moments take place before the change of the trend;
downtrend (red zone), when both slides are above the price values.
Cryptovizor table is the best crypto screener with charts, which gives the opportunity to choose assets that correspond to the chosen trading strategy. The working online screener provides an opportunity not to short on an uptrend and not to long during a downtrend.
Multicharts Binance
This tab contains a grid of line charts built at the closing price of each minute. In the toolbar, you can select periods (not to be confused with timeframes): 15, 30, 45 minutes, 1, 2, 3, 4, 6, 12 hours and 1 day. Sorting by ticker, price change and volatility is available.
Cryptovizor line charts is a cryptocurrency screener that provides an opportunity to visually assess assets and evaluate their suitability for the chosen trading strategy, in particular for scalping cryptocurrencies.
Trends
The Trends tab allows you to easily track trends within the day, using the same time periods as in the Line Charts tab.
Green color indicates an uptrend, when the price at the beginning of the selected period was lower than the current price.
Red color designates the downtrend - the price at the beginning of the period was higher than the current price.
Yellow color (sign "=") means flat (the price has not changed).
The right block of the Trends tab allows you to select coins that are trending in the same direction in all time periods. The Bounce column shows coins that moved in the same direction intraday, but reversed within the last two hours. When trading a trend, this allows you to enter a trade when there is a pullback during a rise or when there is a bounce during a fall.
The Trends tab is an ideal cryptocurrency screening tool for intraday traders - for daytraders.
Heatmap
The Heatmap tab is designed for active traders. You can select timeframes of 5, 15, 30 minutes, 1, 2, 4, 12 hours and 1 day, as well as specify the display and sorting criteria: by volume, volume change (in percent), price change, volatility and RSI change. It is possible to filter the map by the nature of changes. For example, you can click on the green filter and see only those coins that have increased trading volume.
Cryptovizor service is designed to strengthen the community of traders and provide all users with a simple and fast market analysis using a crypto scanner. We know that our service can make trading easy and profitable.
Last updated
