🎯
Cryptovizor
English
English
  • 🎯Cryptovizor User Manual
  • Modules overview
    • 🚀Delta BTC module
      • Delta and cumulative delta
      • Description of the Delta module
    • 📈Cryptoscreener module
      • Volume Screener
      • Left block table
      • RSI Screener
      • Right block table
      • Volatility factor
    • 🏆Cryptocurrency Heatmap Binance
      • Heatmap construction
      • Volume
      • Volume change
      • Price change
      • RSI change
      • Volatility
    • 🔋Multicharts + Trends
      • Defining a trend
      • Trends table
    • ⚡Signals, notifications module
      • Single alerts
        • Creating a single alert
        • Alert Parameters for Price Timeframe
        • Getting a chart in Telegram
      • Notification parameters
        • 1. PRICE notifications
        • 2. Volume USDT Moving
        • Order of magnitude volume
        • 3. Positive Delta Volume USDT Moving
        • 4. Negative Delta Volume USDT Moving
        • 5. Any Delta Volume USDT Moving
        • 6. RSI notifications
        • 7. Volatility
        • 8. Volume USDT Candlesticks
        • 9. MA Trend
        • 10. MA 50
        • 11. MA 200
      • Saving an alert
      • Creating a notification from the Tradingview chart
      • Group signals
        • Token System
        • Creating a group signals
        • Examples of signal combinations
      • Alert logs
      • Draft
      • Webhooks
        • How to Create a Webhook?
        • Finandy configuration
        • List of Webhooks
        • Webhook templates
        • Placeholders
        • Signal setup in Finandy
      • Webhook logs
    • 🖥️Terminal Tradium
    • ◀️Connecting Telegram
    • ⚙️Settings
      • Watchlists
      • Running line
      • MA parameter
      • Push notifications
        • Setting up MacOS
        • Setting up Windows
        • Brave browser
        • Opera browser
        • Google Chrome browser
        • Safari browser
      • Change Email and Name
  • General information
    • YouTube
    • Pricing
    • Rules
    • Contacts
    • Policy
    • FAQ
Powered by GitBook
On this page
  1. Modules overview
  2. Cryptoscreener module

RSI Screener

PreviousLeft block tableNextRight block table

Last updated 1 year ago

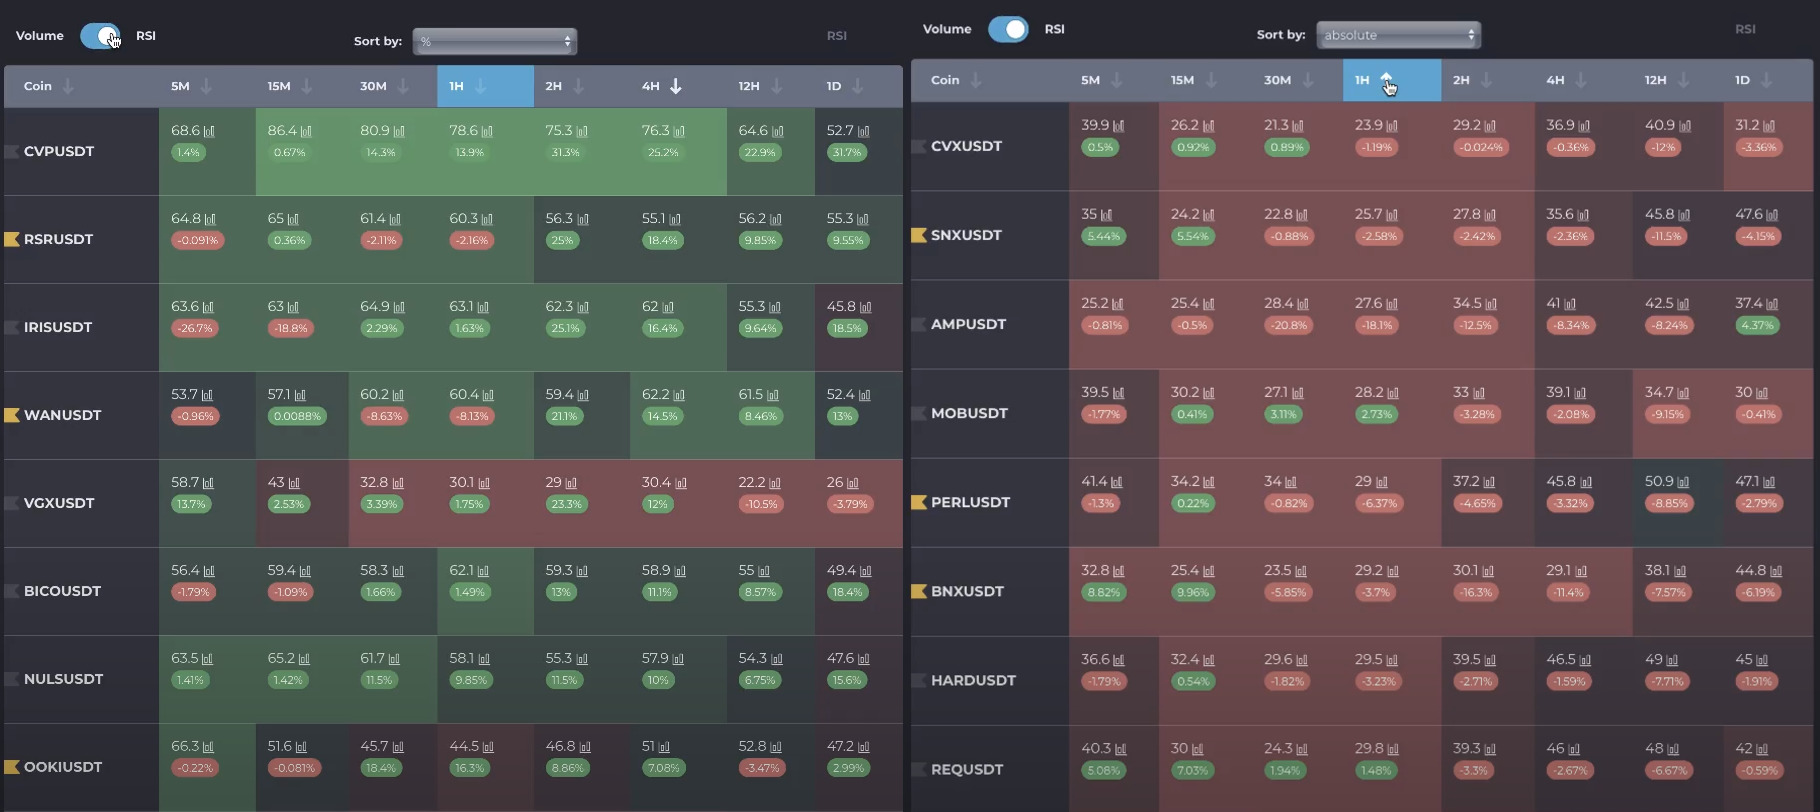
Switch in RSI position

When the Volume & RSI switch is in the "RSI" position, the columns with the corresponding timeframes show the values of this parameter. At that, the table cells are highlighted by a gradient of six shades, depending on the absolute value of RSI.

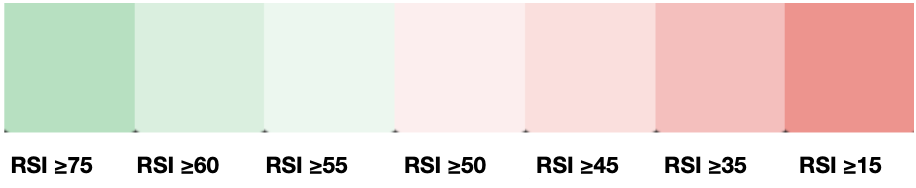
Bright red indicates the strongest downward movement, while bright green indicates the strongest upward price movement.

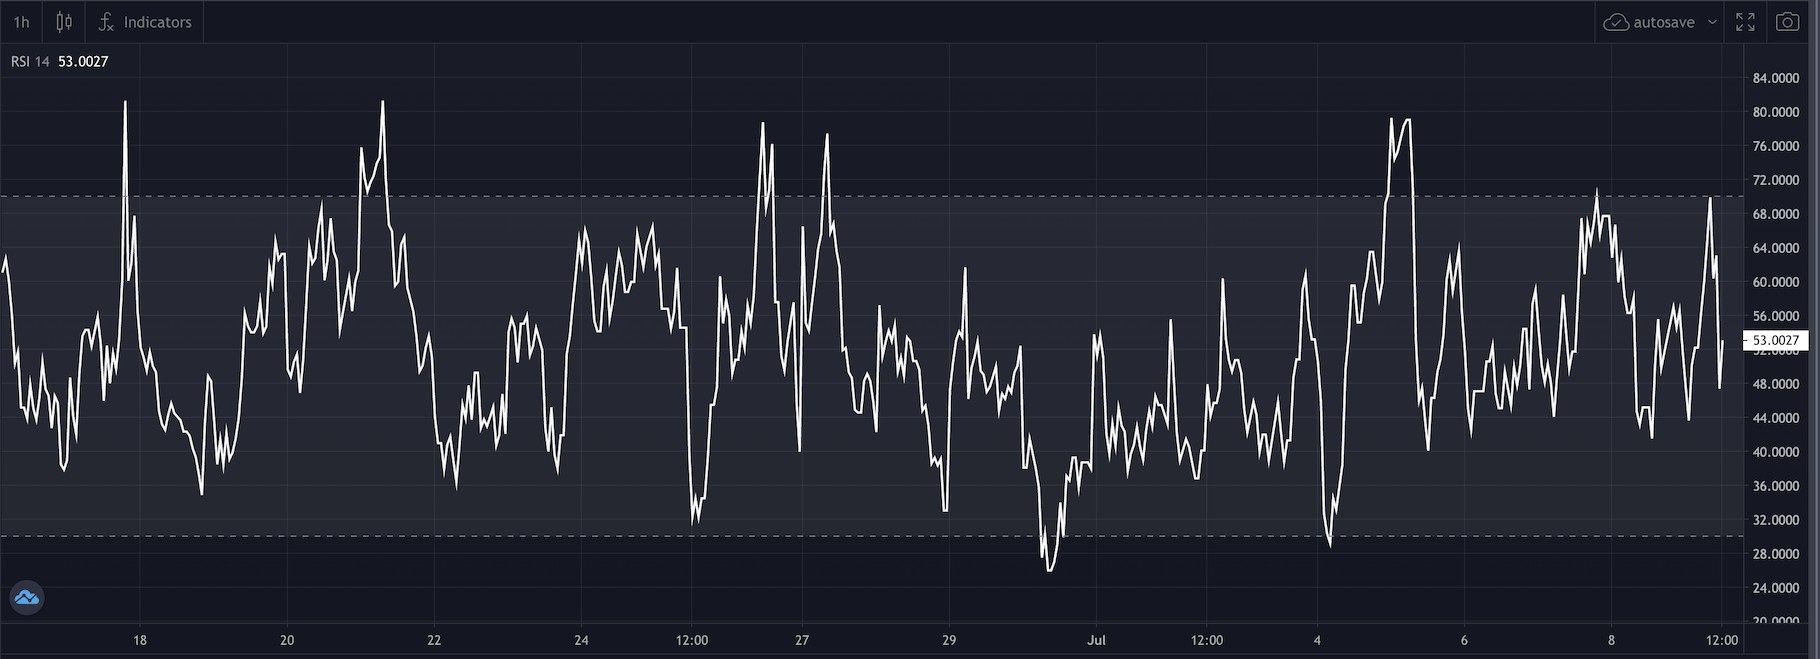
When calculating the RSI we use the standard value of 14 periods.

Cryptovizor is a cryptocurrency screener with charts. In each cell of the table next to the absolute value of Volume or RSI there is an icon, clicking on which allows you to open the chart of the corresponding timeframe.

You can navigate between timeframes using the computer keyboard arrows or the graphic buttons on the left and right of the chart, as well as from the toggle panel in the upper left corner.

You can move to the next or previous ticker using the keyboard arrows or the buttons at the top and bottom of the chart.

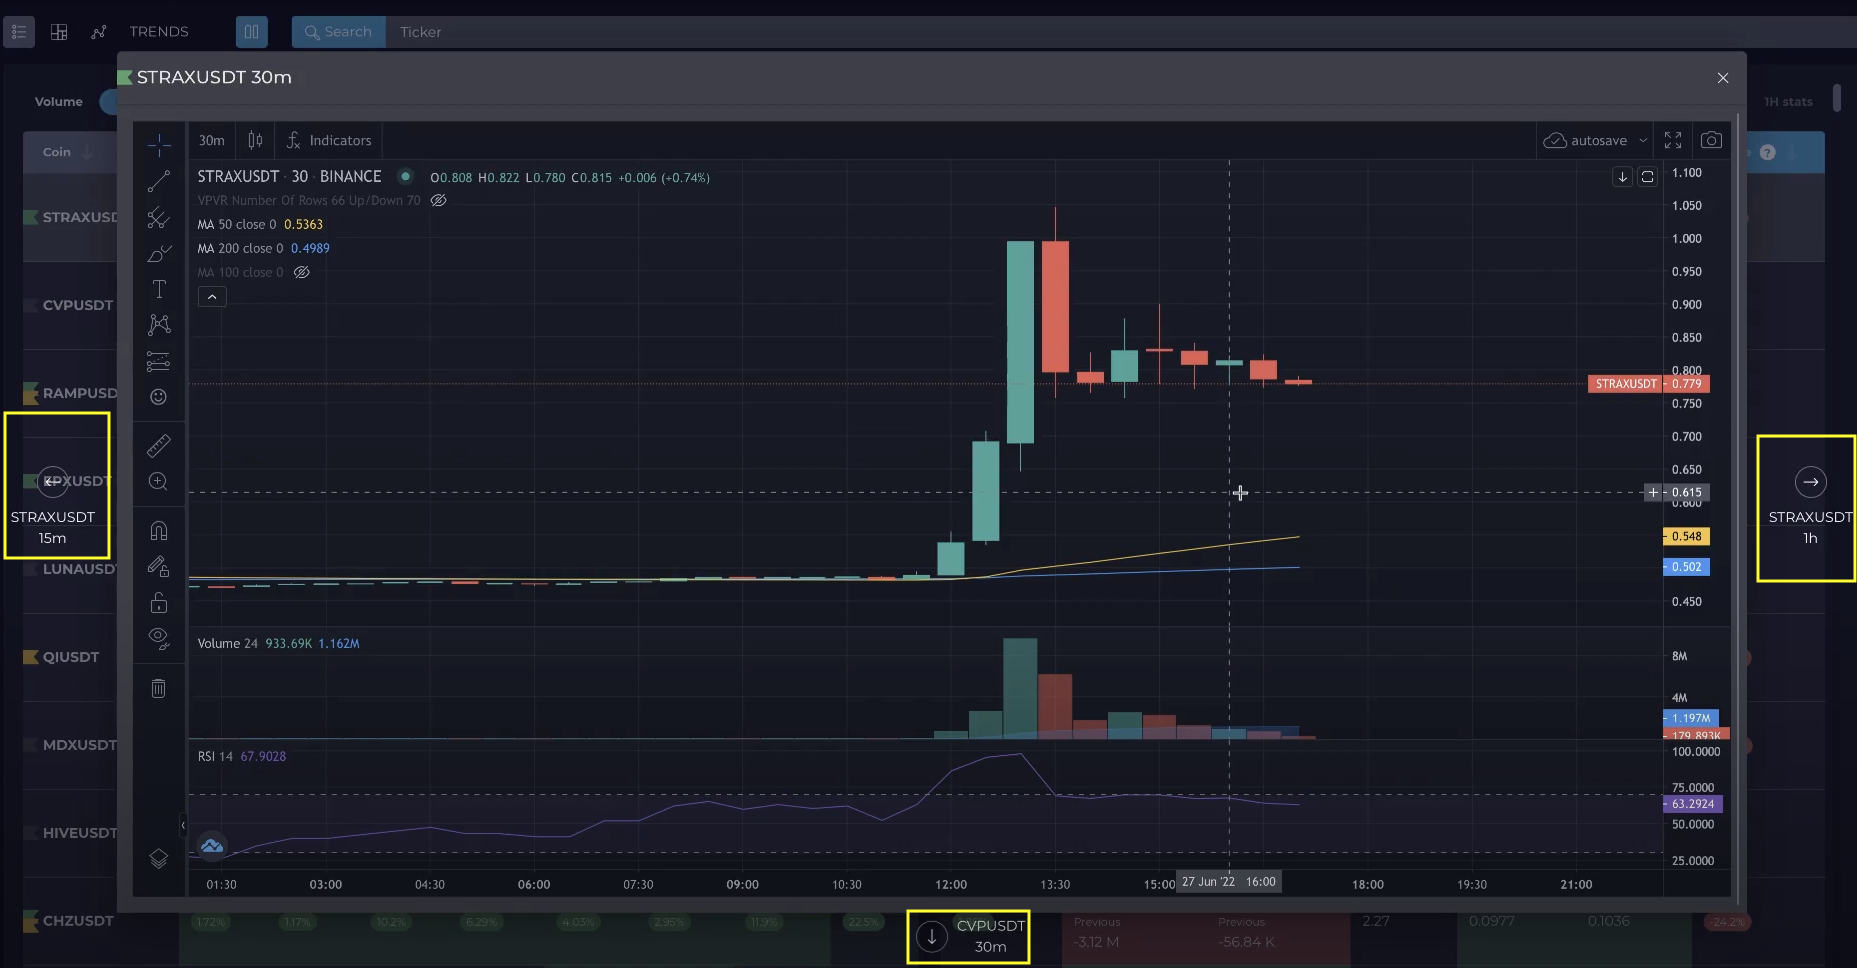
You can add standard indicators to the TradingView library, apply your own markup, and create alerts directly from the chart.

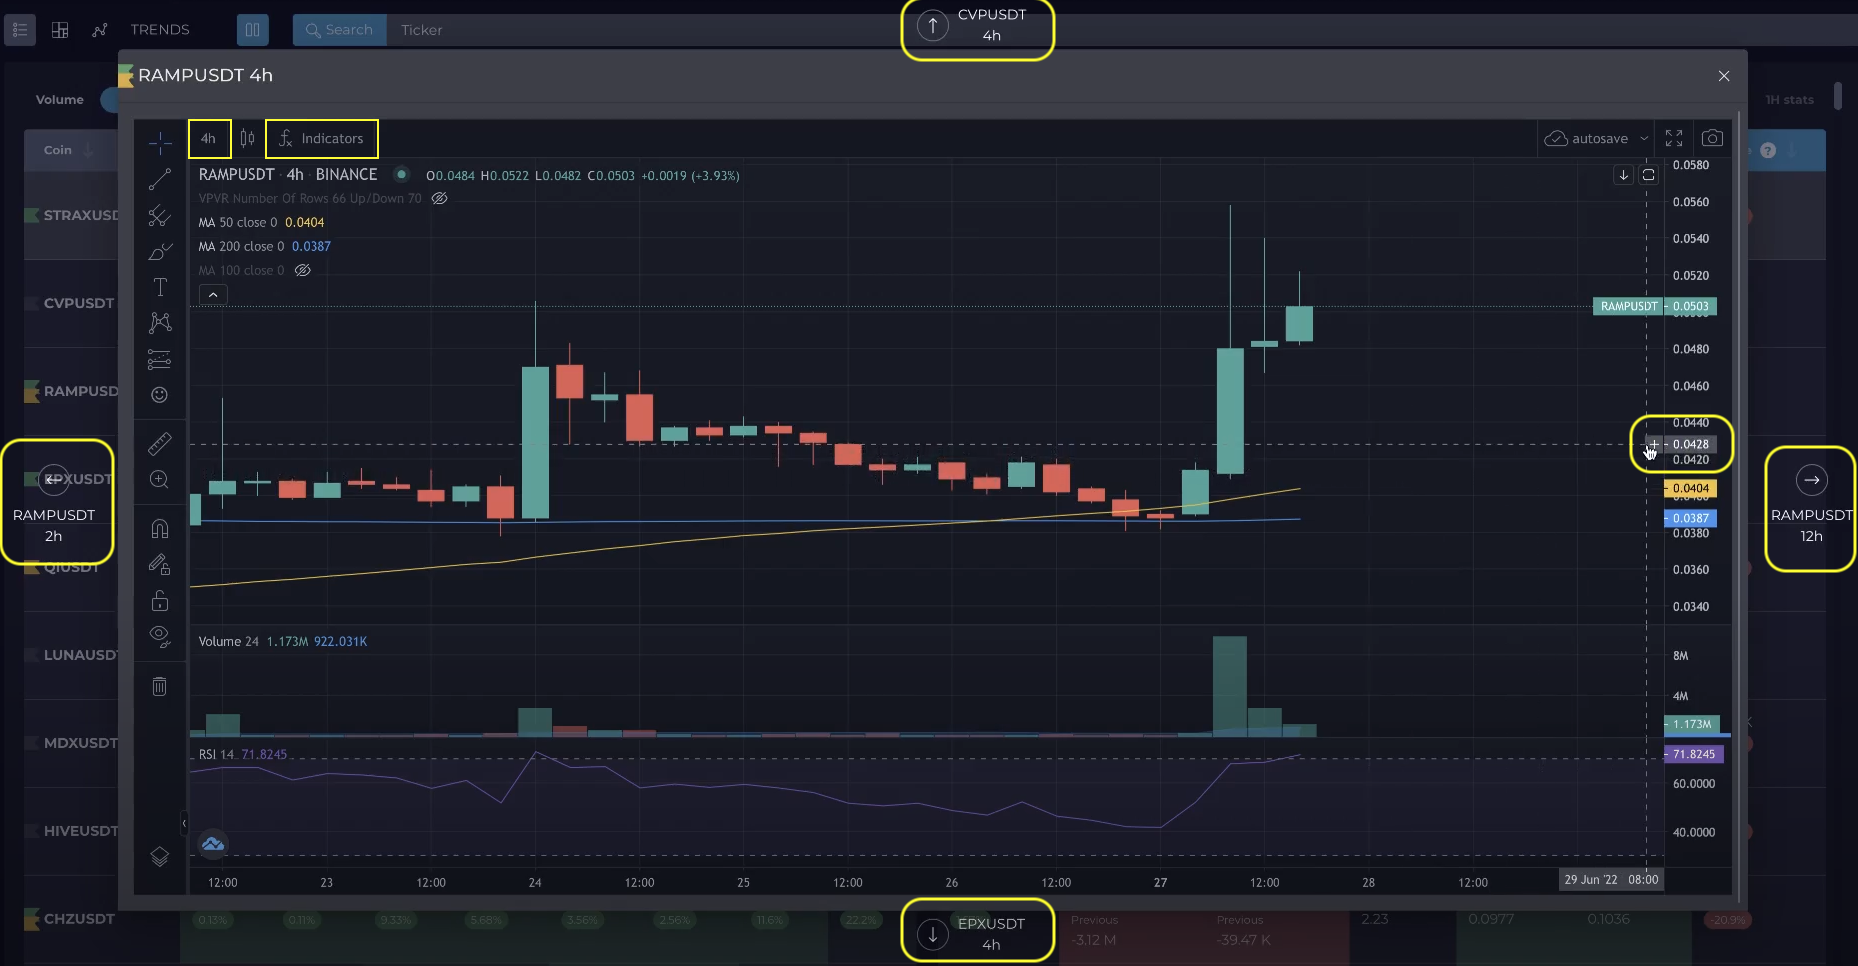
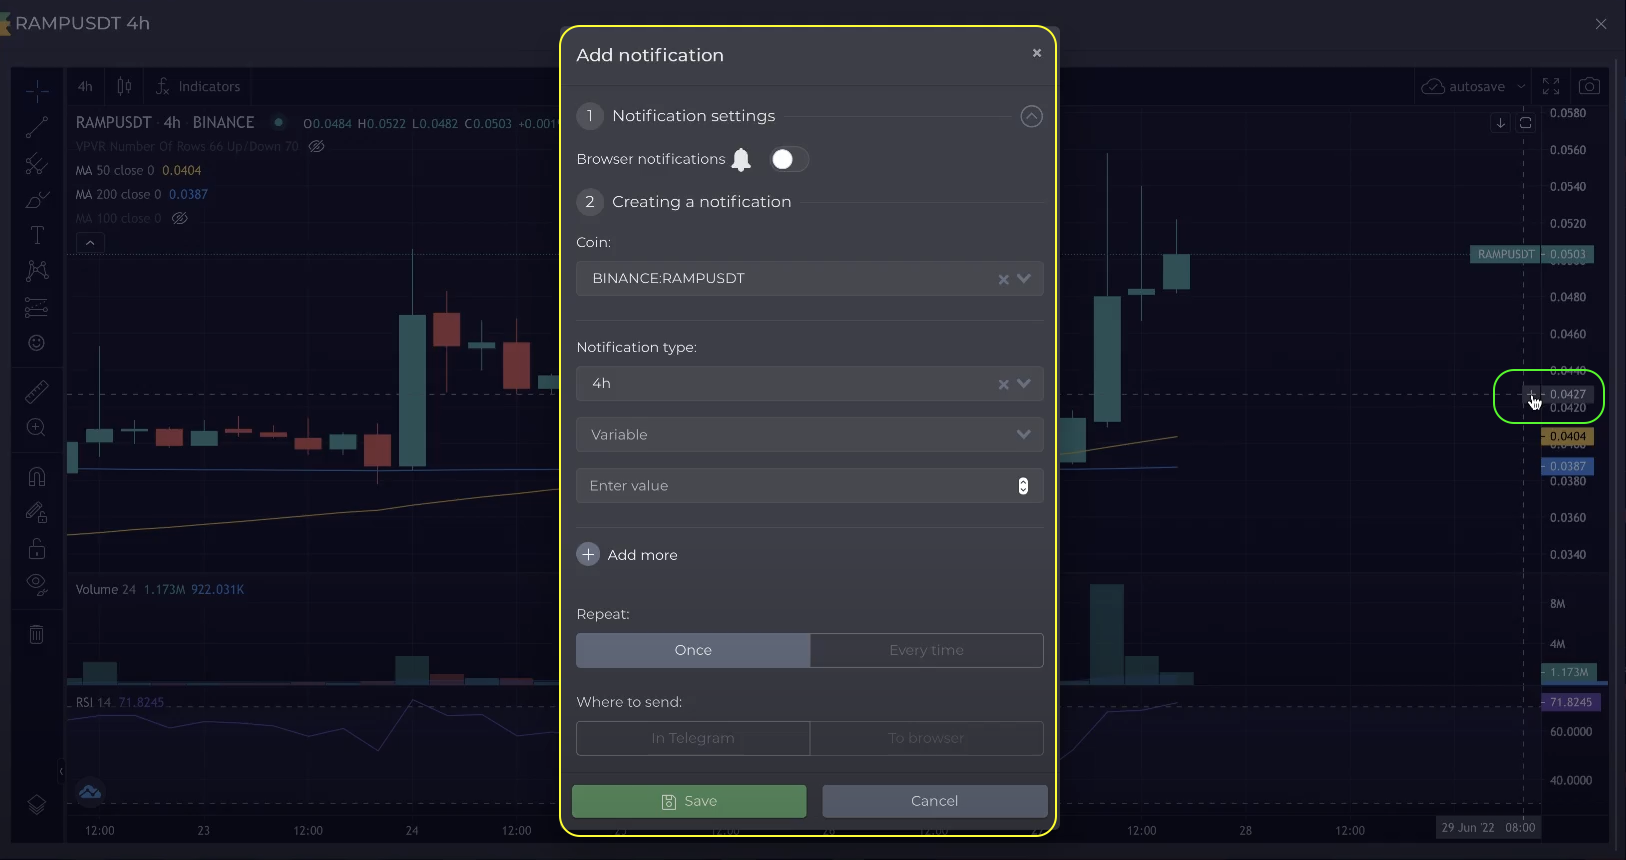
To create an alert, click on the plus sign next to the price scale. The alert creation window opens, where you can set the necessary parameters, select a timeframe, and send the alert to Telegram and/or your browser.

The graph window can be closed with the Esc key on the computer keyboard.

To stop the background data update in the screener, click the "Pause" button; click it again to resume the data update.

📈