🎯
Cryptovizor
English
English
  • 🎯Cryptovizor User Manual
  • Modules overview
    • 🚀Delta BTC module
      • Delta and cumulative delta
      • Description of the Delta module
    • 📈Cryptoscreener module
      • Volume Screener
      • Left block table
      • RSI Screener
      • Right block table
      • Volatility factor
    • 🏆Cryptocurrency Heatmap Binance
      • Heatmap construction
      • Volume
      • Volume change
      • Price change
      • RSI change
      • Volatility
    • 🔋Multicharts + Trends
      • Defining a trend
      • Trends table
    • ⚡Signals, notifications module
      • Single alerts
        • Creating a single alert
        • Alert Parameters for Price Timeframe
        • Getting a chart in Telegram
      • Notification parameters
        • 1. PRICE notifications
        • 2. Volume USDT Moving
        • Order of magnitude volume
        • 3. Positive Delta Volume USDT Moving
        • 4. Negative Delta Volume USDT Moving
        • 5. Any Delta Volume USDT Moving
        • 6. RSI notifications
        • 7. Volatility
        • 8. Volume USDT Candlesticks
        • 9. MA Trend
        • 10. MA 50
        • 11. MA 200
      • Saving an alert
      • Creating a notification from the Tradingview chart
      • Group signals
        • Token System
        • Creating a group signals
        • Examples of signal combinations
      • Alert logs
      • Draft
      • Webhooks
        • How to Create a Webhook?
        • Finandy configuration
        • List of Webhooks
        • Webhook templates
        • Placeholders
        • Signal setup in Finandy
      • Webhook logs
    • 🖥️Terminal Tradium
    • ◀️Connecting Telegram
    • ⚙️Settings
      • Watchlists
      • Running line
      • MA parameter
      • Push notifications
        • Setting up MacOS
        • Setting up Windows
        • Brave browser
        • Opera browser
        • Google Chrome browser
        • Safari browser
      • Change Email and Name
  • General information
    • YouTube
    • Pricing
    • Rules
    • Contacts
    • Policy
    • FAQ
Powered by GitBook
On this page
  1. Modules overview
  2. Cryptocurrency Heatmap Binance

Volume change

PreviousVolumeNextPrice change

Last updated 1 year ago

Volume change is the percentage change in trading volume.

We use the moving method of calculating the trading volume, which shows the value at the current moment, minus N periods ago, where "N" is the selected timeframe.

The difference between moving and bar trading volume is that volume is not reset to zero when a candle closes.

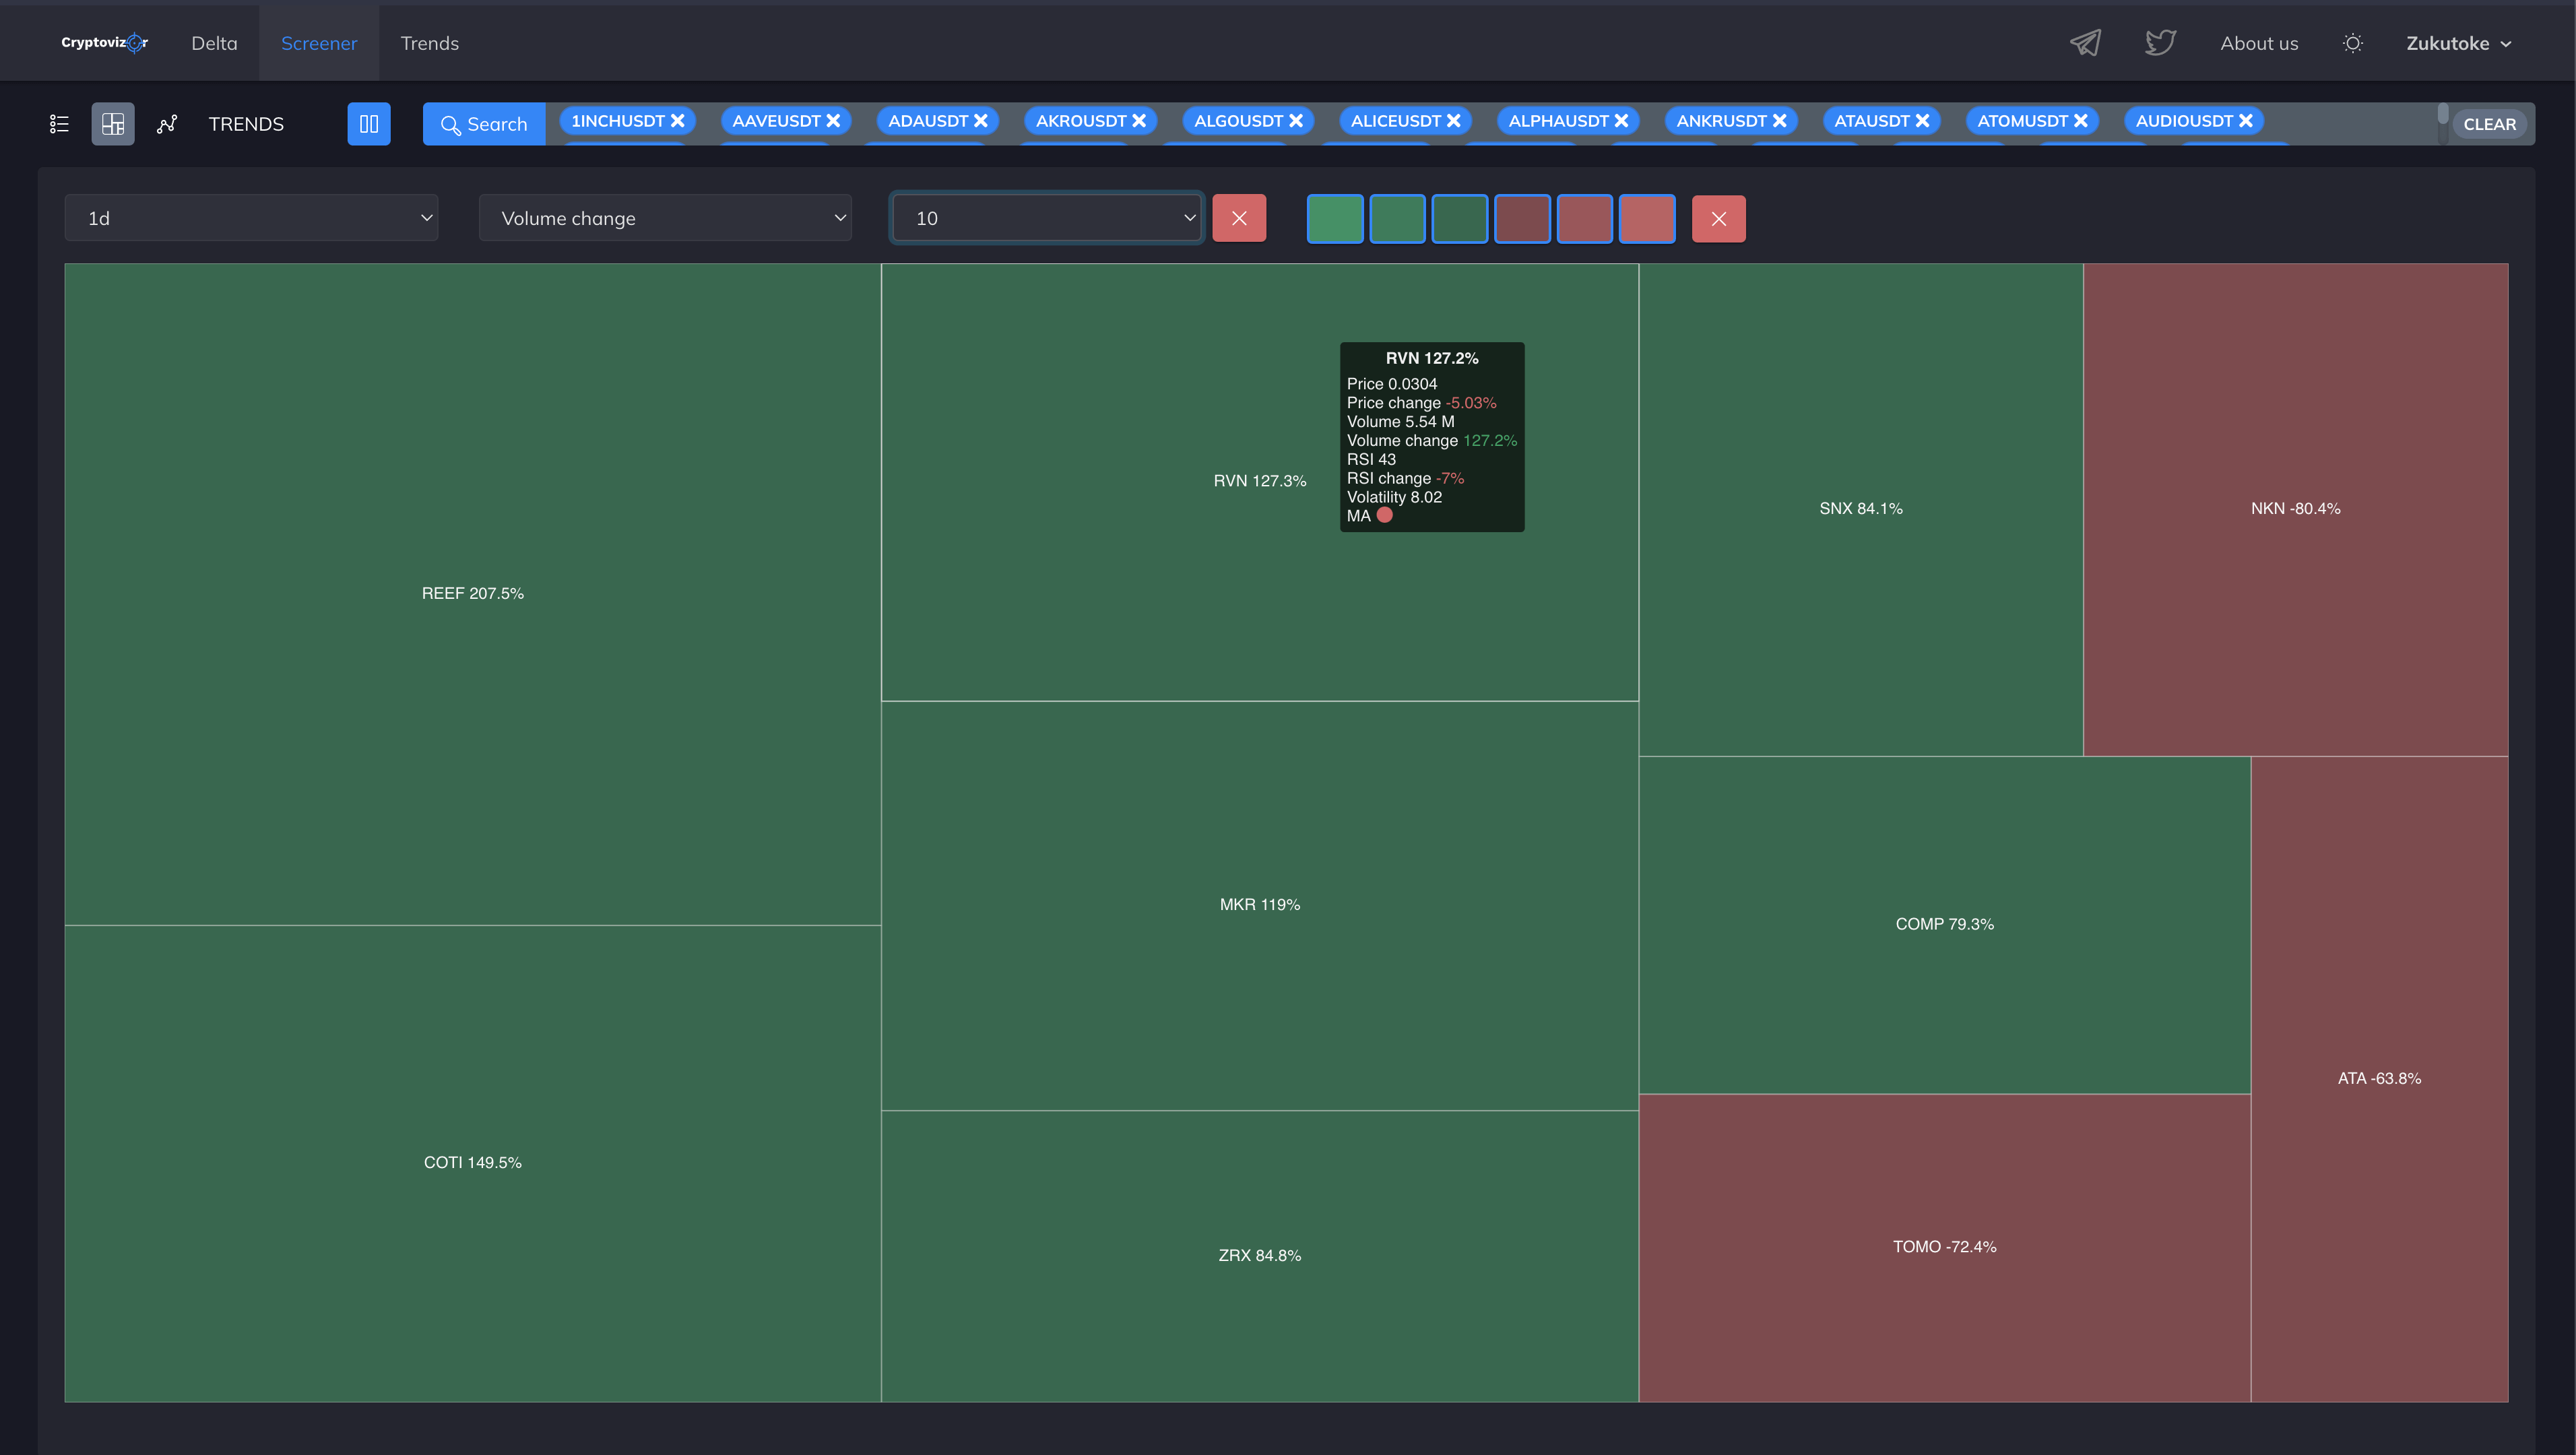
If the 1D timeframe is selected, the Volume change filter and the maximum number of displayed elements in the heatmap is 10, then you will see the top 10 coins by the percentage of volume change per 1D (24H). In this case, the beginning of the period (Y) 1D will be the current moment (X) minus 24 hours (N)

Y = X - N

The color of the cell will depend on the value of Volume change (the percentage change in trading volume). If the volume changes down, the cell will be red, if it has increased, it will turn green.

And the brightness of the cell directly depends on the value of Volume (trading volume). Light green or red indicates the highest trading volume, while dark color indicates the lowest trading volume among the selected coins.

🏆