Volume
Volume
“Volume” is the trading volume in USDT. As you know, we use a moving method of trading volume calculation. It shows the value of the current moment minus N periods ago, where N is the selected timeframe
The moving and per-bar trading volumes differ in that when the candle closes, the volume value is not reset to zero.
If you select the Volume filter with a 1D timeframe and ten displayed elements, the map will display the top ten coins by trading volume from the watchlist or list of coins you selected. If the search field is left empty, the map will be generated based on all the coins from the screener.
The size of each cell will indicate the ratio of the maximum value of the selected filter relative to the minimum value.

If you hover over a cell of the map, you will see the values for the current timeframe in a pop-up window.
TICKER
Price – current price
Price change – price change percentage
Volume – trading volume in USDT
Volume change – volume change percentage
RSI – the value of the RSI indicator with a standard period of 14
RSI change – percentage change in the value of the RSI indicator
Volatility – price volatility value
MA – the value of the state of the trend by moving averages. (The default is MA50 and MA200. You can set other values in the settings).
Delta - Difference between market buy and sell volume for the selected time frame
CD Week - Cumulative delta between buy and sell volume for the week
The color of the cell depends on the Volume change value (percentage of change in trading volume), if the volume has changed to the lower side - red fill, if it has increased - green.
The brightness of the cell depends on the Volume (trading volume) value, where light green/red color is the highest trading volume, and dark color is the lowest trading volume among the selected coins.
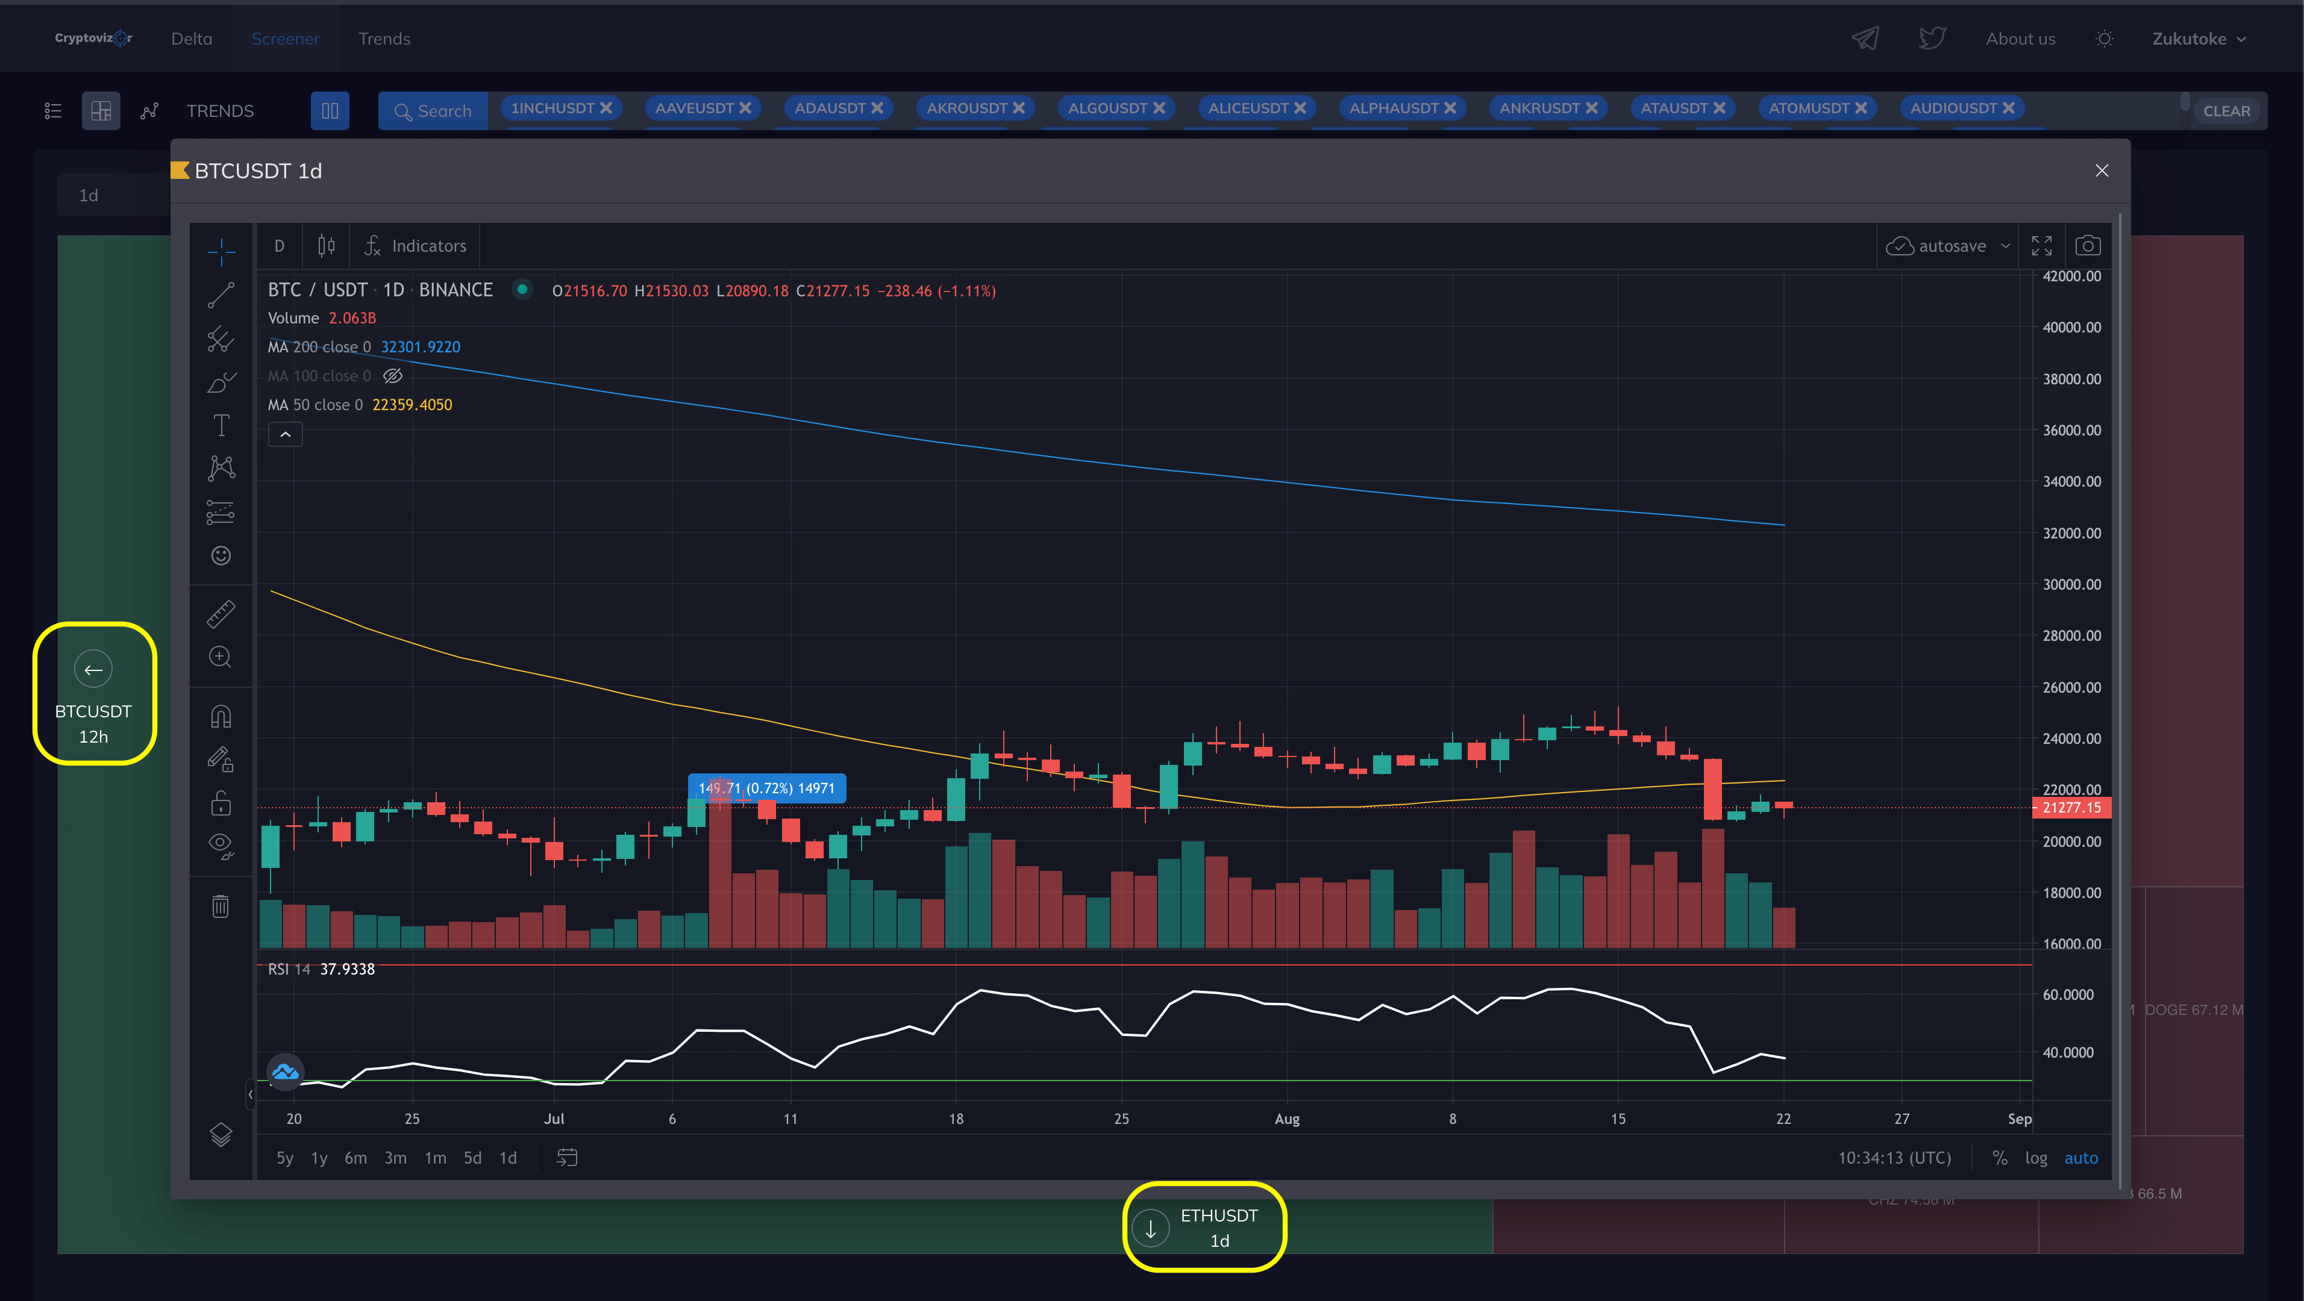
Clicking on the map cell opens the chart in the selected timeframe

For ease of navigation and switching timeframes, you can use the buttons on the borders of the chart window or using the keyboard arrows.
Markup on the charts is combined with all the tabs of the screener, you can start working in the heat map, and then continue markup in the table, everything will be saved automatically.
Last updated